Obesity

Boulder Colorado Again Leads in Lower Obesity Rate

Posted on
Share

Gallup est Oesity Chart

According to the latest Gallup Poll.

For the third consecutive year, residents of the Boulder, Colo., metro area are the least likely to be obese, at 12.5% in 2012. Residents of McAllen-Edinburg-Mission, Texas, continue to be the most likely to be obese, at 38.5%. Adult obesity rates are higher than 15% in all but two of the 189 metro areas that Gallup and Healthways surveyed in 2012.

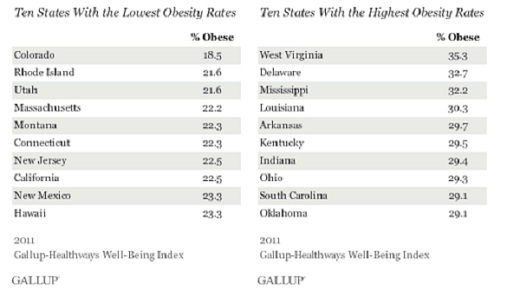
Here is the chart for the worst areas for obesity.

Gallup Worst Obesity Chart
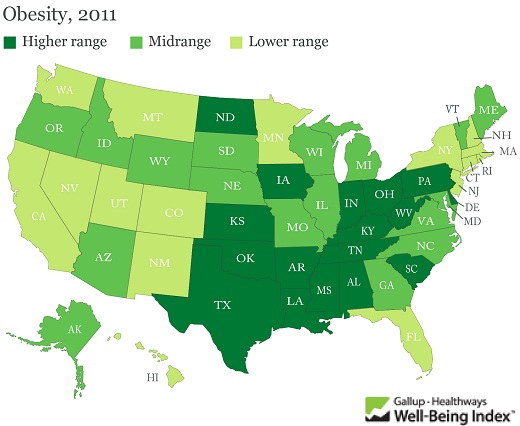
Obesity continues to be a problem in the United States and follows demographic trends.

Nationwide, 26.2% of Americans aged 18 and older were obese in 2012, unchanged from 26.1% in 2011. Of the 189 reportable metro areas surveyed in 2012, 102 had obesity rates lower than the national average. Nineteen of the 25 most populous metro areas surveyed boasted obesity rates lower than the national average. Smaller metro areas were more likely to have above-average obesity rates, consistent with past reporting.

In the 11 metro areas with the highest obesity rates, the average annual wages are lower than in the 10 areas with the lowest obesity rates, reflecting the link between obesity and poverty. The average annual wage in the 11 areas with the highest obesity rates is $38,550, this compares with an average annual income of $47,783 for the 10 areas with the lowest obesity rates. Additionally, residents in the most obese areas, on average, earn $7,240 below the national mean wage of $45,790, while residents of the least obese areas average $1,993 more annually than the national mean wage.

Residents in the areas with the highest obesity rates are also 7.9 percentage points less likely than are those in the areas where obesity is lowest to have enough money to be able to buy food at all times. They are also 6.5 points less likely to have enough money for healthcare and medicine.

Share
Obesity

Gallup Poll: 2012 Obesity Rate Stable in America

Posted on
Share

Gallup Poll on obesity


According to the latest Gallup Poll

Americans were as likely to be obese in 2012 as they were in 2011. But the 26.2% who were obese in 2012 remains slightly higher than the 25.5% recorded in 2008. Another 36.1% of Americans were overweight in 2012 and about as many were a normal weight — 35.9%.

The 2012 data comprise more than 350,000 surveys of American adults. The Gallup-Healthways Well-Being Index uses respondents’ self-reports of their height and weight to calculate body mass index (BMI) scores. Individual BMI values of 30 or above are classified as “obese,” 25 to 29.9 are “overweight,” 18.5 to 24.9 are “normal weight,” and 18.4 or less are “underweight.”

The World Health Organization further classifies BMIs of 30.00 or higher into one of three classes of obesity:

Obese class I = 30.00 to 34.99
Obese class II = 35.00 to 39.99
Obese class III = 40.00 or higher

Those with BMIs of 40 or higher — obese class III — are often considered “morbidly obese.” Based on self-reports of height and weight, 3.6% of American adults were “morbidly obese” in 2012. This is on par with 3.4% in 2011 and 3.5% in 2009 and 2010.

Here is a Gallup chart on obesity and demographic groups:

Gallup chart on obesity and demographicsThe bottom line is that there is much to do for better health.

Obesity is a preventable condition and with better education, Americans will be able to live longer and healthy.

Share
Exercise

Poll: Frequent Exercise Slightly Up in 2012

Posted on
Share

Frequent Exercise chart

Good news regarding exercise, in light of the report on obesity that was released the other day.

More Americans exercised frequently in August (54.7%) than did in the same month in past years — continuing a pattern Gallup and Healthways have found through most of 2012. In every month this year, except for April, more Americans reported exercising three or more days per week than did so in the same month for each of the past four years.

Gallup and Healthways ask 1,000 American adults daily about their exercise habits as part of the Gallup-Healthways Well-Being Index. Specifically, Americans report how many days in the past seven they exercised for at least 30 minutes.

The uptick in frequent exercise this year has come amid “the warmest first eight months of any year on record” in the U.S., according to the National Oceanic and Atmospheric Administration. Whether there is a direct relationship between these warm temperatures and higher exercise levels — or it is mere coincidence — is not certain.

However, that Americans’ exercise habits are seasonal — they work out more in the spring and summer months and less in the fall and winter — points to the weather playing a role in their likelihood of exercising.

Good job, America!

And, while this slight increase may be seasonal and related to the weather, it is also possible that educational efforts promoting a healthy lifestyle may be having an effect.

Share
Diet

Fewer Americans Eating Healthy in 2011

Posted on
Share


According to the latest Gallup Poll.

Americans’ self-reported healthy eating habits dipped slightly in 2011, after improving in 2010. The percentage of Americans reporting they ate healthy all day “yesterday” declined to 66.1% in 2011 from 67.7% in 2010. Likewise, 56.0% of Americans reported eating five or more servings of fresh fruits and vegetables on at least four days in the previous week last year, down from 57.1% in 2010. As a result, the gains observed from 2009 to 2010 were essentially undone last year.

This is not good news.

Come on folks, spend a little time in preparing an appropriate, nutritional diet and exercise a little bit.

It is for better health!

Healthy eating can help reduce people’s risk for heart disease, high blood pressure, diabetes, osteoporosis, and several types of cancer, as well as help them maintain a healthy body weight. Good eating habits mean consuming various nutritious foods and beverages, especially vegetables, fruits, and low-fat and fat-free dairy products; limiting intake of saturated fats, added sugars, and sodium; and balancing caloric intake with calories burned to manage body weight.

Share
Health

Poll Watch: Obesity and Chronic Diseases Stable Across the United States in 2011

Posted on
Share

According to the latest Gallup Poll.

Colorado had the lowest adult obesity rate in the nation in 2011, as it did last year, and is the only state where fewer than 20% of adults are obese. West Virginia holds onto the negative distinction of being the state with the highest obesity rate; 35.3% of residents living there are obese, the highest for any state that Gallup and Healthways have found since 2008.

The national obesity rate declined slightly to 26.1% in 2011, from 26.6% in 2010. Across states, obesity rates remained statistically unchanged from 2010 to 2011 in all but two — New Jersey and Kentucky — where they declined. This marks a positive change from the recent past. Obesity had inched up in 2009 and 2010 compared with 2008 nationwide and in some states.

These data, collected as part of the Gallup-Healthways Well-Being Index, are based on respondents’ self-reports of their height and weight, which are used to calculate Body Mass Index (BMI) scores. Americans who have a BMI of 30 or higher are classified as obese.

The obesity rate continues high, but at least it did not increase this past year. Is the word getting out about the problem?

Here is a chart about the best and worst states:


High Blood Pressure, Diabetes Rates Also Hold Steady Across States

It is interesting that the states in the South and the Midwest lag the other states and have higher rates of obesity and chronic diseases. They also have the higher rates of smoking.

There needs to be more awareness and education about the needs to eat right, exercise regularly and not smoke – for a more healthy and productive life.

Share