Health

Poll Watch: American’s Weight Up Almost 20 Pounds Since 1990

Posted on
Share

According to the latest Gallup Poll.

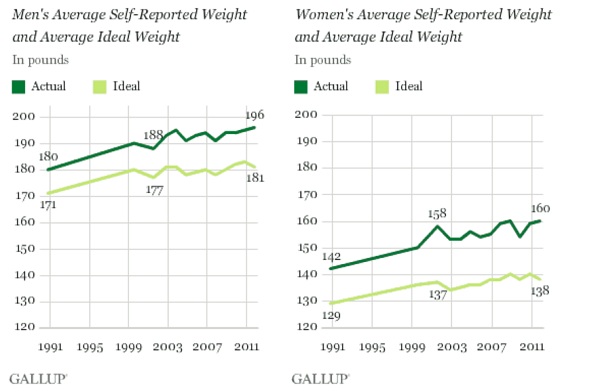
American men, on average, say they weigh 196 pounds and women say they weigh 160 pounds. Both figures are nearly 20 pounds higher than the average that men and women reported in 1990. As Americans’ actual weight has increased, so has their ideal weight.

Today, men on average say their ideal weight is 181 pounds and women say 138 pounds.

Men’s and women’s perceptions of their own ideal weight have generally increased over the same period that their self-reported actual weight has increased, although to a somewhat smaller degree. This means that not only do men and women report that they weigh more today versus 20 years ago, but they are also getting further away from their ideal weight.

Comparing the self-reports of actual and ideal weights, the average man weighs 15 pounds more than his ideal today, compared with 9 pounds in 1990. The average woman weighs 22 pounds more than her ideal today, compared with 13 pounds in 1990. The current figures for men and women are the highest Gallup has measured to date.

These results are based on Gallup’s annual Health and Healthcare survey, conducted Nov. 3-6. Gallup has asked Americans to say how much they weigh yearly since 2001 and in 1990 and 1999.

Subtracting men’s and women’s average self-reported weight from their average ideal weight reveals that 64% of men and 68% of women are currently over their ideal weight.

Certainly, not a good trend.

Not only are Americans more overweight and obese, they are in denial about it.

By the way, my weight has edged down another two pounds and I will be resetting my goals to reflect this study.

Share
Cancer

Poll Watch: Smoking Rates Range From a High of 29% in Kentucky to Low of 11% in Utah

Posted on
Share


According to the latest Gallup Poll

Nationwide, smoking rates range from a high of 29% in Kentucky to a low of 11% in Utah, according to Gallup-Healthways Well-Being Index data collected in the first half of 2011.

Each day, Gallup and Healthways ask 1,000 Americans, “Do you smoke?” The January-June 2011 results are based on 177,600 interviews conducted as part of the Gallup-Healthways Well-Being Index. These results provide a preliminary picture of 2011 state smoking rates, ahead of the final full-year data, which will be available in early 2012.

As the American Cancer Society’s Great American Smokeout Thursday urges smokers to attempt to quit their habit, the Gallup-Healthways Well-Being Index finds an average of 21% of all Americans saying they smoke in the first half of this year. This has gone unchanged since Gallup and Healthways started tracking Americans’ smoking habits in 2008.

So far this year, there are 18 states with smoking rates lower than 20%, compared with 8 states in 2010, 11 in 2009, and 10 in 2008. There are 11 states with rates of 25% or higher, fairly similar to recent years.

Here is the chart:

Gallup has found that the American national smoking rate is stuck at around 21%. This is historically lower than from the mid-1940s to the mid-1970s where the rate was close to 40%.

Let’s see if with better education we can lower that rate.

Today is the American Cancer Society’s Great American Smokeout
– please if you don’t smoke, don’t start. If you do smoke, then please quit.
Share
Obesity

Poll Watch: Half of German Adults are Obese and Overweight

Posted on
Share

According to the latest Gallup Poll.

Half of German adults are obese (13.7%) and overweight (36.4%), similar to the 54.5% in the United Kingdom, but significantly less than the 62.1% in the United States.

These data were collected as part of the Gallup-Healthways Well-Being Index from March to September 2011 in Germany, the U.K., and the U.S.

The Gallup-Healthways Well-Being Index uses respondents’ self-reports of their height and weight to calculate body mass index (BMI) scores. Individual BMI values of 30 or higher are classified as “obese,” 25.0 to 29.9 are “overweight,” 18.5 to 24.9 are “normal weight,” and 18.4 or less are “underweight.”

Still lower than the United States which is at 62.1%.

But, like the U.S. and U.K – way too high!

Share
Diet

Poll Watch: More Americans a Normal Weight Than Overweight

Posted on
Share

According to the latest Gallup Poll.

The percentage of Americans who are overweight or obese declined slightly in the third quarter of 2011, while the percentage who are a normal weight increased. For the first time in more than three years, more Americans are a normal weight (36.6%) than are overweight (35.8%).

The overweight and normal weight trend lines have tracked closely together since Gallup and Healthways started monitoring Americans’ weight situation daily in January 2008. Though it is noteworthy that more adults are now a normal weight than overweight, it is too early to tell if this shift is temporary or permanent.

The recent slight decline in the nation’s obesity rate is a positive contrast to the rising levels found in 2009 and throughout most of 2010. However, the majority of Americans are still at an unhealthy weight — either overweight or obese (61.6%).

The Gallup-Healthways Well-Being Index uses respondents’ self-reports of their height and weight to calculate body mass index (BMI) scores. Individual BMI values of 30 or higher are classified as “obese,” 25.0 to 29.9 are “overweight,” 18.5 to 24.9 are “normal weight,” and 18.4 or less are “underweight.”

Good news, but there is still more weight to lose.

Obesity Rates Down Across Demographic Groups

Black Americans, the middle-aged, and those with low incomes remain the most likely to be obese across major demographic subgroups in an aggregate of the data collected in all three quarters of 2011 — as generally has been the case historically.

However, obesity rates for each of those groups and all others included in this analysis are either trending down or are statistically unchanged so far in 2011.

The chart:

So, what does this all mean?

Although a majority of Americans remain overweight or obese, it is a good sign that the obesity rates are trending downward. Perhaps Americans are learning more about adopting a healthy diet and exercise program. Perhaps it is the economic recession and folks are eating out less at fast-food restaurants that have menus that are high in caloric and fat content?

It is hard to say.

But, let’s hope that the trend continues in a downward direction = for better health.

Share
Dentistry

Poll Watch: Massachusetts and Connecticut Lead America in Dentist Visits

Posted on
Share


According to the latest Gallup Poll.

Three in four Massachusetts residents say they visited a dentist in the last 12 months, a higher rate than in any other state in the nation. Those living in Mississippi were least likely to say they go to the dentist, followed by Louisiana and West Virginia residents.

These state-level data, collected as part of the Gallup-Healthways Well-Being Index, are from January through June 2011 and encompass more than 177,000 interviews conducted among national adults, aged 18 and older. Nationwide, an average of 65% of all American adults say they visited a dentist in the last 12 months during this time period, essentially unchanged from past years.

Here is the chart for the most and least dentist visit states:

And, not surprisingly, there is a relationship between having dental insurance and a dentist visit.

Here is the chart:

So, what does this all mean?

There are regional disparities in visiting the dentist. Any programs designed for dental health education will need to be tailored with these regional and perhaps cultural differences in mind.

Poor oral care can lead to many potential negative health outcomes. When combined with other risk factors, poor oral health can be linked to heart disease, stroke, atherosclerosis, rheumatoid arthritis, and diabetes, among others. Maternal periodontal disease, too, has been linked to preterm births.

The range in good oral health behaviors across the 50 states is considerable and may be indicative of several factors, including household income. Having health insurance coverage — which is related to income — also appears to be a critical factor in dental visits. However, it should be noted that the Well-Being Index only confirms whether a respondent has health insurance, not dental insurance. Based on the Well-Being Index data, a 10-percentage-point increase in the percentage of Americans with health insurance could mean as much as a 6-point increase in the percentage who visit the dentist each year, with a potentially considerable positive effect on many of the negative health outcomes associated with poor oral health.

Share