Health

Study: Cigarette Smoking Causes More Aterial Damage in Women

Posted on
Share


According to a new study.

The harmful effects of tobacco smoke on atherosclerosis, one of the driving forces of cardiovascular disease, are greater in women than in men.

This result emerges from the large European epidemiological study (Carotid Intima Media thickness and IMT-PROgression as predictors of Vascular Events: the IMPROVE study), funded by EU (Vth Framework Program — Contract n. QLG1-CT-2002-00896). In the IMPROVE study, authors examined 1694 men and 1893 women from Finland, Sweden, Netherlands, France and Italy, and used ultrasound technology to assess the presence of wall thickening and plaques in the carotids, the arteries that bring blood to the brain.

The research shows that the amount tobacco exposure during the entire life significantly correlates with the thickness of carotid arterial walls (an index of atherosclerosis) in both genders. However, the impact is more than doubled in women than in men. Similarly, the effect of the number of cigarettes smoked per day on the progression of the disease over time is more than five-fold in women than in men. These associations are independent from other factors that may affect atherosclerosis, such as age, blood pressure, cholesterol level, obesity and social class.

Elena Tremoli, Professor of Pharmacology at the University of Milan, Italy, and scientific director of the Monzino Cardiology Centre in Milan who led the study, says: “This is a particular relevant finding, especially in view of the fact that educational campaigns carried out in the last years have been less successful in reducing the number of smokers in women than in men.”

According to WHO, while in most European countries a significant proportion of men has quit smoking, in many countries (e.g. Italy and Finland) the percentage of women smokers remained roughly constant in the last three decades, whereas in others (France, Spain) it even increased.

“The reasons for the stronger effect of tobacco smoke on women’s arteries are still unknown, but some hints may come from the complex interplay between smoke, inflammation and atherosclerosis,” says Prof. Tremoli.

Researchers found that other factors, besides smoking, have a differential effect on the arteries of men and women. One of these is education, a well known index of social class: while men who have studied less showed a greater thickening of arterial walls than those who have studied more, the same was not true for women. Similarly, women, in contrast with men, seem to be protected against the harmful effects of systemic inflammation. Indeed, in the IMPROVE study, the relation between arterial wall thickening and the levels of C-Reactive Protein (CRP) and white blood cells (WBC) counts, two indexes of inflammation, is very strong in men, but absent in women.

“It is important to mention, however, that, when women smoke they lose their protection against the harmful effect of inflammation. In particular, if we stratify the female population according to smoking habits, we see that in the group of women who smoke, especially in heavy smokers, the relationship between CRP and arterial wall thickening becomes similar to that observed in men,” says Prof. Tremoli.

“We all know that women are ‘naturally’ protected against cardiovascular disease, particularly before menopause, and this has led to less attention of health professionals and researchers in regard to this disease in women.

Women, who for some reason appear to be less vigilant about heart disease, should take this study to their own heart. If you smoke, you have an increased risk of heart disease – more than the men.

So, stop smoking!

Share
Concussion

In College Football Running Backs Hit the Hardest to the Head

Posted on
Share

USC Trojans Football Helmet

And, linemen receive the most frequent hits to the head according to a new study.

Thousands of college football players began competing around the United States this week, but with the thrill of the new season comes new data on the risks of taking the field. A new study reports that running backs and quarterbacks suffer the hardest hits to the head, while linemen and linebackers are hit on the head most often. The researchers measured head blows during games and practices over three seasons at Brown University, Dartmouth College, and Virginia Tech.

The study, led by Joseph J. Crisco, professor of orthopaedics in the Warren Alpert Medical School of Brown University and director of the bioengineering laboratory at Rhode Island Hospital, documented 286,636 head blows among 314 players in the 2007-09 seasons. Crisco said the new data on the magnitude, frequency, and location of head blows amounts to a measure of each player’s head impact exposure. Ultimately it can help doctors understand the biomechanics of how blows to the head result in injury.

“This allows us to quantify what the exposure is,” Crisco said. “It is the exposure that we need to build upon, so that we can then start understanding what the relationships are with acute and chronic head injury.”

The study appears online in advance in the Journal of Biomechanics.

Concussions and other head injuries have become a source of elevated concern in football and other sports in recent years, with various leagues revising policies to protect players better. In part based on seeing this new data, said Robin Harris, Ivy League executive director, league officials announced earlier this year that full-contact practices would be limited to two a week.

Concussions are a real concern in football.

Protection of the teeth with a custom-fit athletic mouthguard also offers protection of the teeth and jaws. They may also aid in the protection against concussion.

So, players, protect the head and teeth and have a great injury-free season.

Share
Medicine

Poll Watch: Southern and Western United States Have Highest Uninsured Rates

Posted on
Share


According to the latest Gallup Poll.

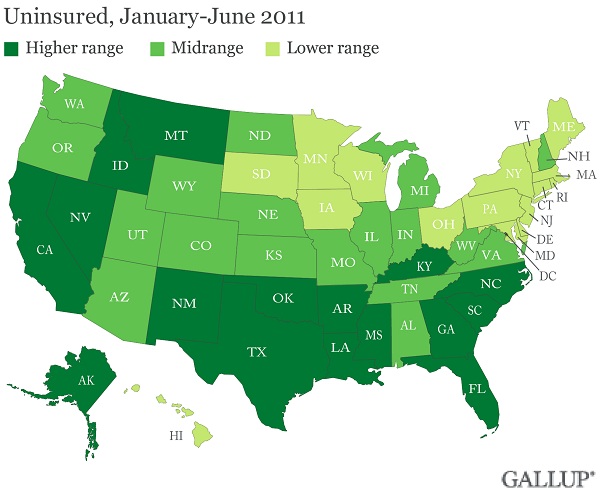
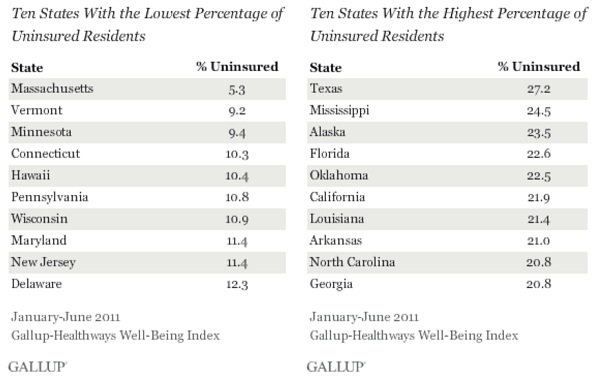
Texas residents continue to be the most likely in the United States to lack health coverage, with 27.2% reporting being uninsured in the first half of 2011. At the other end of the spectrum is Massachusetts, where health insurance is required and 5.3% of residents lack coverage. These two states have represented the upper and lower bounds of uninsured rates since Gallup and Healthways started tracking coverage in 2008.

These results are based on 177,237 interviews conducted daily from January through June 2011 as part of the Gallup-Healthways Well-Being Index. An average of 16.8% of all American adults were uninsured in the first half of 2011, similar to the 16.4% in 2010. This percentage, however, has been edging up each year since 2008, at which time 14.8% of adults were uninsured. The percentage of uninsured residents in all states so far in 2011 is on par with 2010, but in most states remains higher than in 2008.

And, the Southern and Western United States have the highest uninsured rates.

States in the South and West continue to have higher numbers of uninsured adults than do those in the Northeast — consistent with what Gallup found in 2008, 2009, and 2010. Eight of the 10 states with the highest uninsured rates in the country are in the South and the other two — California and Alaska — are in the West.

Texas, California, and Florida — all three of which have an uninsured rate higher than 20% — have disproportionately large Hispanic populations, the demographic group Gallup finds to be the most likely to be uninsured.

Uninsured rates are lower in the Northeast, with 7 of 10 states with the fewest uninsured residents located there, as in past years.

The chart:

So, what does this mean?

President Obama’s Affordable Care Act has had little effect on people being insured or not. With the states struggling with budgets, it is difficult to see how many more people can be provided insurance without affecting the people that already have coverage.

Uninsured rates across states in 2011 appear to be relatively stable so far compared with 2010, but remain higher than in 2008. This could be seen as good news at a time when states are grappling with deep budget cuts and the implementation of new regulations and programs required under the Affordable Care Act. However, more than 10% of adults lack healthcare coverage in almost all states, with more than 15% going uninsured in 29 states. The fate of uninsured rates in America remains precarious as numerous states are challenging the legality of the new healthcare law in court.

Share
Diet

Weight Loss From Reducing Calories Can Lead to Unrealistic Expectations

Posted on
Share

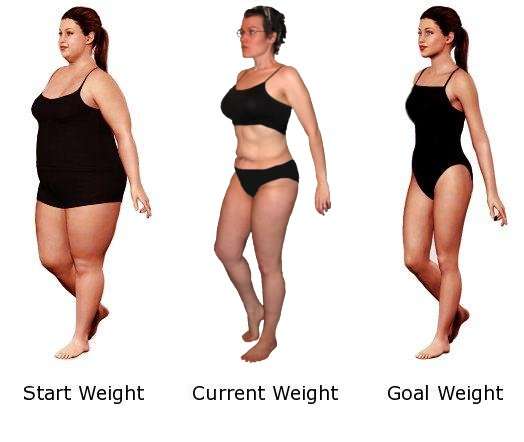
This post of a paper caught my eye this morning, since I am dieting and trying to reduce my body weight. I am using My Fitness Pal online and count calories in and exercise calories expended. So far I have lost about 9 pounds.

Common rules of thumb exaggerate how much weight people will lose from a given dietary calorie reduction, leading to unrealistic expectations and disappointment, researchers said.

Whereas patients are often told that cutting 500 calories a day will let them lose a pound a week, a more realistic formula is that such a caloric reduction would lead to a 50-pound loss over three or more years, according to Kevin D. Hall, PhD, of the National Institute of Diabetes and Digestive and Kidney Diseases in Bethesda, Md., and colleagues.

Even then, they explained in the Aug. 27 issue of The Lancet — a special edition devoted to obesity — such weight loss is possible only if the calorie reduction is actually maintained over that time.

The standard rules — endorsed by the National Institutes of Health and the American Dietetic Association, among others — fail to consider that human metabolism responds dynamically to changes in diet and body composition, Hall and colleagues asserted.

If a 300-pound dieter could really lose a pound a week by cutting his regular diet by 500 calories, he would vanish entirely in six years.

“This ubiquitous weight-loss rule (also known as the 3,500 [calorie]-per-pound rule) was derived by estimation of the energy content of weight lost, but it ignores dynamic physiological adaptations to altered body weight that lead to changes of both the resting metabolic rate as well as the energy cost of physical activity,” the researchers wrote.

When people gain weight, their baseline energy needs increase, to keep the extra tissue alive and to move it around. Likewise, when weight is lost, their baseline needs decrease.

So when people cut calories below the baseline requirement — thereby triggering weight loss — the gap between their intake and their baseline energy needs begins to shrink. At some point, it may disappear altogether, at which point weight loss stops.

Hall and colleagues put together what they said was a better model of caloric intake and resultant weight loss, incorporating feedback mechanisms to reflect metabolic changes over time in response to diet and body weight.

It indicated that weight change in response to caloric restriction occurs over a relatively long period of time.

Each reduction of 100 kilojoules daily — 24 calories — in intake eventually leads to a loss of 1 kg (2.2 lbs) in body weight, the researchers determined. But only half that loss occurs in the first year. In three years, 95% of the ultimate loss will be realized.

On the flip side, using data from previous studies, Hall and colleagues said their calculations suggest that the U.S. population has a persistent excess energy intake of 30 kilojoules (7.2 calories) per day, explaining the increasing prevalence of overweight and obesity.

For the population to return to body mass index values that prevailed in the 1970s, average diets would need to shrink by about 220 calories per day.

The researchers pointed out that these figures are averages for the adult population. Individuals’ metabolic requirements for sustaining a given body mass vary substantially.

Consequently, “a given diet results in an uncertain degree of energy deficit,” Hall and colleagues wrote.

I suppose I will just have to be patient and wait the three to five years to reach my weight goal. But, then again, I have been packing on the extra weight for decades now and I cannot expect a quick fix.

I can do it.

Share
Health

Older Americans with a College Education Have Better Emotional Health After Age 65?

Posted on
Share

Yes, according to the latest Gallup Poll.

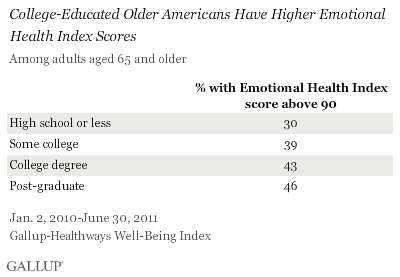
Older Americans with a college education are significantly more likely to be emotionally well-off than are people in this age group with less education. Among those aged 65 and older, these results hold even after statistically controlling for gender, race, marital status, employment, satisfaction with standard of living, and regional location.

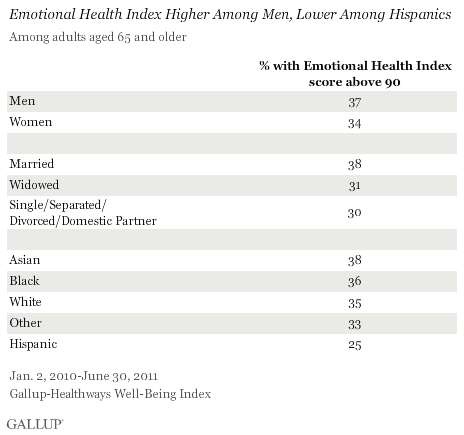
The emotionally well-off are defined as individuals whose scores on the Gallup-Healthways Emotional Health Index are above 90, out of a maximum of 100. The Emotional Health Index is based on a comprehensive measure of emotional wellbeing asking Americans whether they felt “a lot of” each of the following emotions the day before the survey: smiling/laughing, learning/doing something interesting, being treated with respect, enjoyment, happiness, worry, sadness, anger, and stress. Among those aged 65 and older, 35% score above 90.

The Demographics:

Older men are slightly more likely than older women to score above 90 on this composite measure of emotional wellbeing, even after statistically keeping all other variables constant. Among racial and ethnic groups, older Hispanics are the least likely to have Emotional Heath Index scores above 90, and this difference persists after holding all other variables constant.

Being married does not appear to improve older Americans’ emotional health. The apparent lack of a “marriage advantage” may be explained, at least in part, by the fact that marital status alone does not take into account the quality of the relationship or other related factors.

An interesting study and another reason to pursue a college education = better emotional health in your senior years.

Share