Dentistry

Poll Watch: Massachusetts and Connecticut Lead America in Dentist Visits

Posted on
Share


According to the latest Gallup Poll.

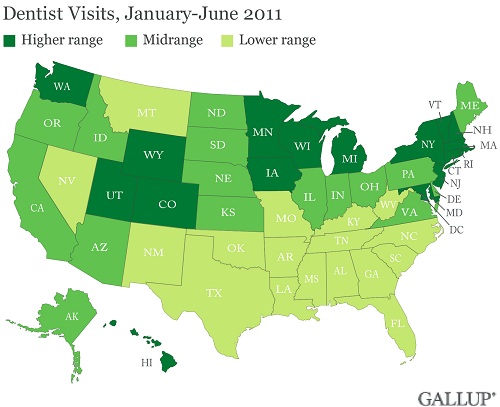
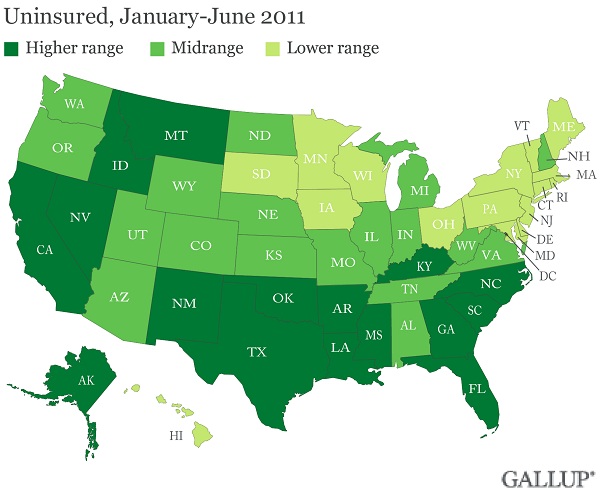
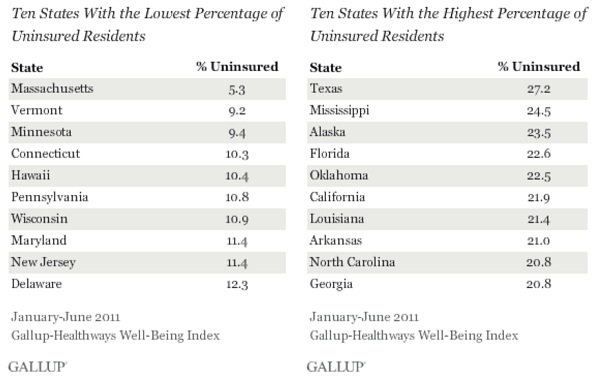
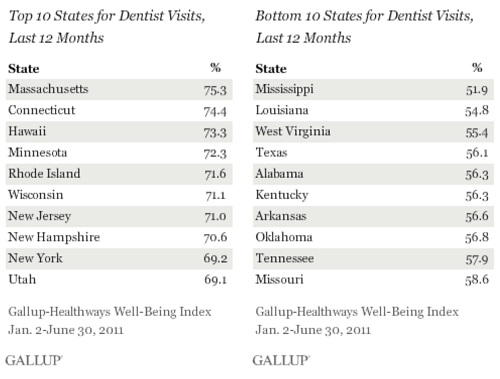
Three in four Massachusetts residents say they visited a dentist in the last 12 months, a higher rate than in any other state in the nation. Those living in Mississippi were least likely to say they go to the dentist, followed by Louisiana and West Virginia residents.

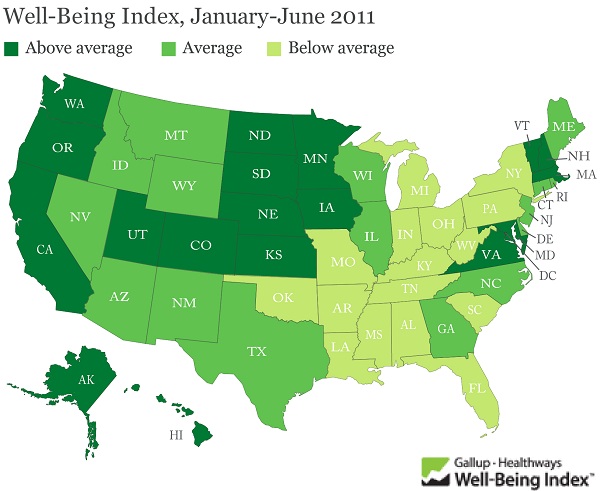
These state-level data, collected as part of the Gallup-Healthways Well-Being Index, are from January through June 2011 and encompass more than 177,000 interviews conducted among national adults, aged 18 and older. Nationwide, an average of 65% of all American adults say they visited a dentist in the last 12 months during this time period, essentially unchanged from past years.

Here is the chart for the most and least dentist visit states:

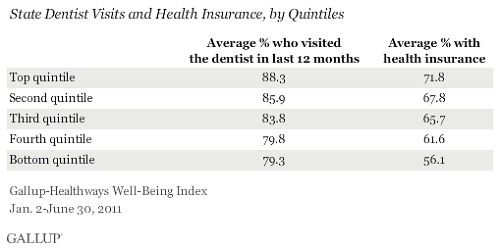
And, not surprisingly, there is a relationship between having dental insurance and a dentist visit.

Here is the chart:

So, what does this all mean?

There are regional disparities in visiting the dentist. Any programs designed for dental health education will need to be tailored with these regional and perhaps cultural differences in mind.

Poor oral care can lead to many potential negative health outcomes. When combined with other risk factors, poor oral health can be linked to heart disease, stroke, atherosclerosis, rheumatoid arthritis, and diabetes, among others. Maternal periodontal disease, too, has been linked to preterm births.

The range in good oral health behaviors across the 50 states is considerable and may be indicative of several factors, including household income. Having health insurance coverage — which is related to income — also appears to be a critical factor in dental visits. However, it should be noted that the Well-Being Index only confirms whether a respondent has health insurance, not dental insurance. Based on the Well-Being Index data, a 10-percentage-point increase in the percentage of Americans with health insurance could mean as much as a 6-point increase in the percentage who visit the dentist each year, with a potentially considerable positive effect on many of the negative health outcomes associated with poor oral health.

Share
Medicine

Poll Watch: Southern and Western United States Have Highest Uninsured Rates

Posted on
Share


According to the latest Gallup Poll.

Texas residents continue to be the most likely in the United States to lack health coverage, with 27.2% reporting being uninsured in the first half of 2011. At the other end of the spectrum is Massachusetts, where health insurance is required and 5.3% of residents lack coverage. These two states have represented the upper and lower bounds of uninsured rates since Gallup and Healthways started tracking coverage in 2008.

These results are based on 177,237 interviews conducted daily from January through June 2011 as part of the Gallup-Healthways Well-Being Index. An average of 16.8% of all American adults were uninsured in the first half of 2011, similar to the 16.4% in 2010. This percentage, however, has been edging up each year since 2008, at which time 14.8% of adults were uninsured. The percentage of uninsured residents in all states so far in 2011 is on par with 2010, but in most states remains higher than in 2008.

And, the Southern and Western United States have the highest uninsured rates.

States in the South and West continue to have higher numbers of uninsured adults than do those in the Northeast — consistent with what Gallup found in 2008, 2009, and 2010. Eight of the 10 states with the highest uninsured rates in the country are in the South and the other two — California and Alaska — are in the West.

Texas, California, and Florida — all three of which have an uninsured rate higher than 20% — have disproportionately large Hispanic populations, the demographic group Gallup finds to be the most likely to be uninsured.

Uninsured rates are lower in the Northeast, with 7 of 10 states with the fewest uninsured residents located there, as in past years.

The chart:

So, what does this mean?

President Obama’s Affordable Care Act has had little effect on people being insured or not. With the states struggling with budgets, it is difficult to see how many more people can be provided insurance without affecting the people that already have coverage.

Uninsured rates across states in 2011 appear to be relatively stable so far compared with 2010, but remain higher than in 2008. This could be seen as good news at a time when states are grappling with deep budget cuts and the implementation of new regulations and programs required under the Affordable Care Act. However, more than 10% of adults lack healthcare coverage in almost all states, with more than 15% going uninsured in 29 states. The fate of uninsured rates in America remains precarious as numerous states are challenging the legality of the new healthcare law in court.

Share
Dentistry

Work is Good for Senior Americans Emotional Health

Posted on
Share

According to the latest Gallup Poll.

While relatively few older Americans work — 9% tell Gallup they work full time, while 11% say they are employed part time — those who are employed have higher Emotional Health Index scores than those who are not working. Even after controlling for all other variables, including standard of living, employed older Americans are still more likely than those who do not work to have strong emotional health. This suggests that having a job can actually be better for older individuals’ emotional wellbeing than not working. However, this relationship is not as strong as satisfaction with standard of living.

Working is good and having some sort of feeling of self-worth is important as you reach your golden years.

Many dentists work well into their 70’s and 80’s – not necessarily for the income because they enjoy the patients and the profession.

Share
Health

Poll Watch: Hawaii Leads in Wellbeing and North Dakota is Second

Posted on
Share


According to the latest Gallup Poll.

Americans in Hawaii continued to set the national standard in wellbeing in the first half of 2011, followed closely by North Dakota. West Virginia and Kentucky maintained their status as the states with the lowest wellbeing. Nebraska, which showed the biggest gains in wellbeing rank from 2009 (25th) to 2010 (10th), continued to move up, landing in the top five.

These state-level data, from the Gallup-Healthways Well-Being Index, are meant to provide a preliminary reading on the wellbeing of U.S. states in anticipation of the complete 2011 rankings, to be released early next year.

The Well-Being Index score for the nation and for each state is an average of six sub-indexes, which individually examine life evaluation, emotional health, work environment, physical health, healthy behaviors, and access to basic necessities. The January through June 2011 aggregate includes more than 177,000 interviews conducted among national adults, aged 18 and older.

The midyear Well-Being Index score for the country so far in 2011 is 66.4, a slight decline from 66.8 for all of 2010. The Well-Being Index is calculated on a scale of 0 to 100, where a score of 100 would represent ideal wellbeing. Well-Being Index scores among states vary by a range of 8.7 points

The Southern States are continuing to struggle with low well being, whereas the Western States are thriving.

More states in the South than anywhere else in the country have wellbeing scores in the lower range, as has been true in the past. Eight of the bottom 11 states in wellbeing (Missouri is classified as a Midwestern state) are Southern states.

Many Western states, in contrast, thrive in wellbeing, with four out of the top seven — Hawaii, Alaska, Colorado, and Utah — located in that region of the country. Five Midwestern states — North Dakota, Nebraska, Minnesota, Kansas, and Iowa — are also in the top 12, as are three Eastern states: New Hampshire, Vermont, and Maryland.

Share
Health

Older Americans with a College Education Have Better Emotional Health After Age 65?

Posted on
Share

Yes, according to the latest Gallup Poll.

Older Americans with a college education are significantly more likely to be emotionally well-off than are people in this age group with less education. Among those aged 65 and older, these results hold even after statistically controlling for gender, race, marital status, employment, satisfaction with standard of living, and regional location.

The emotionally well-off are defined as individuals whose scores on the Gallup-Healthways Emotional Health Index are above 90, out of a maximum of 100. The Emotional Health Index is based on a comprehensive measure of emotional wellbeing asking Americans whether they felt “a lot of” each of the following emotions the day before the survey: smiling/laughing, learning/doing something interesting, being treated with respect, enjoyment, happiness, worry, sadness, anger, and stress. Among those aged 65 and older, 35% score above 90.

The Demographics:

Older men are slightly more likely than older women to score above 90 on this composite measure of emotional wellbeing, even after statistically keeping all other variables constant. Among racial and ethnic groups, older Hispanics are the least likely to have Emotional Heath Index scores above 90, and this difference persists after holding all other variables constant.

Being married does not appear to improve older Americans’ emotional health. The apparent lack of a “marriage advantage” may be explained, at least in part, by the fact that marital status alone does not take into account the quality of the relationship or other related factors.

An interesting study and another reason to pursue a college education = better emotional health in your senior years.

Share